Movement For Growth
Health and Transport Strategy - Interactive Map
Summary
Map Key
West Midlands Area
Everyone travels or lives on streets. Where they are well designed with health and wellbeing goals in mind, they can be at the heart of cohesive and supportive communities. They can encourage physical activity by making it easier to walk and cycle, and have wider impacts on everyone’s health by reducing air pollution and increasing the feeling of safety.
Streets that make the West Midlands healthier and happier will also make it more economically active. Transport can play a large part in increasing productivity and reducing the demand for public services by preventing ill health and improving the wellbeing of people at work.
Life expectancies in the West Midlands have increased, ever since 2001, and in some areas men are expected to live to 80.4 years old and women 84.2 years old. However, recent years have seen a slow-down in the rate that they are increasing, and life expectancy in some parts of the West Midlands may even be decreasing.
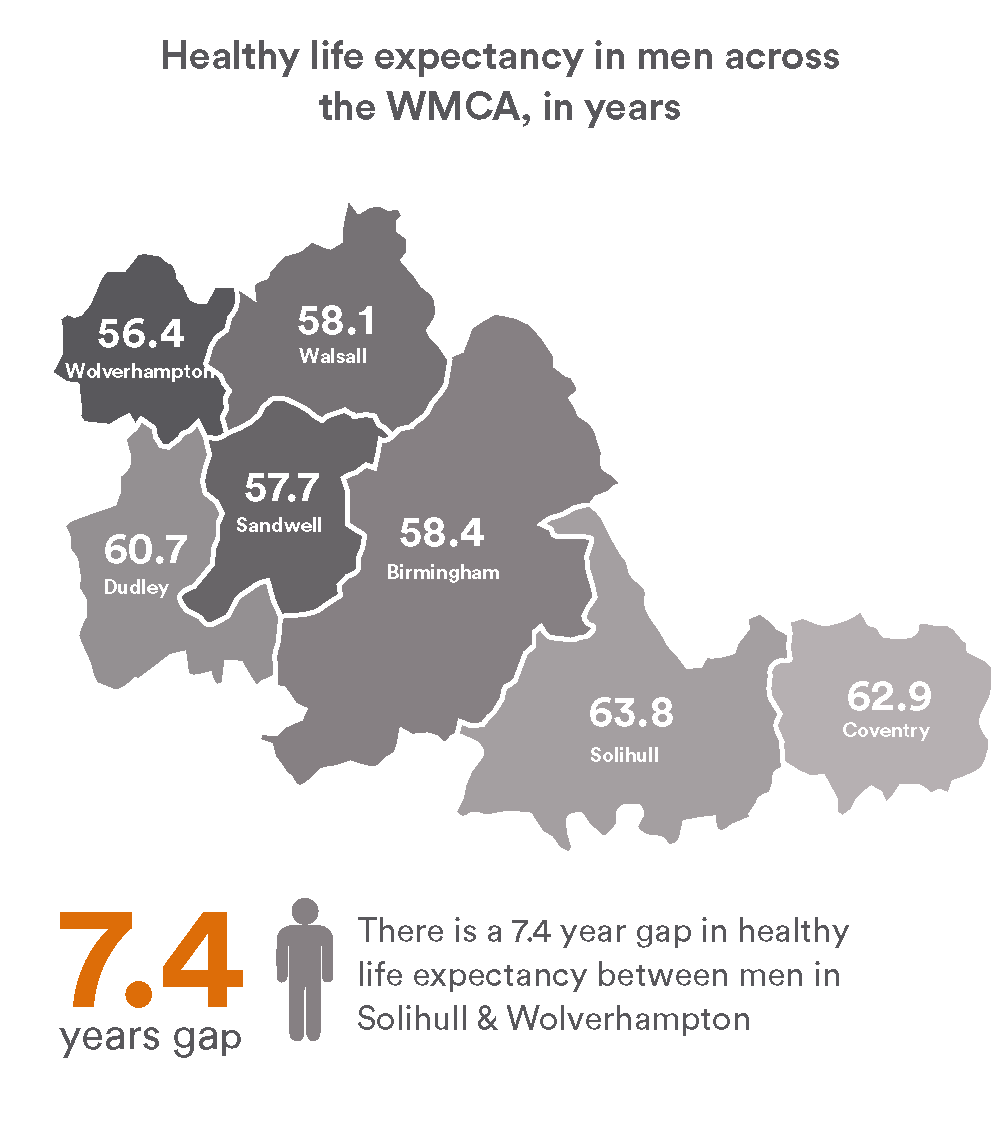
Healthy life expectancies are lower still. The lowest male healthy life expectancy is in Wolverhampton where men are expected to live 56.4 years in good health. Similarly, in Walsall women are expected to live 59 years in good health.
There are also inequalities in health. Some of the more deprived areas within the West Midlands have even lower healthy life expectancies and people might only expect to live for 50 years in good health. This is a barrier to inclusive economic growth in the West Midlands.
Transport investment to improve health has a large impact. The number of people who might benefit from interventions can be large. Transport can improve health by several different ways, and where schemes are designed to address many of these the benefits can be maximised.
"Transport can play a large part in increasing productivity and reducing the demand for public services by preventing ill health and improving the wellbeing of people at work."

Cleaner Air
Map Key
Traffic conditions
Emissions of many pollutants have been falling since the 1970s, although the trend has slowed in recent years, the concentration of pollutants that people are exposed to has not fallen as quickly. This means that in the urban parts of the West Midlands, large numbers of people are living in areas of poor air quality and large amounts of traffic. This harm is more likely to fall on people living in deprived areas, who contribute fewer emissions to the problem.
Particulate matter is made up of small particles suspended in the air. It is caused by emissions from vehicle exhausts, but the wearing down of tyres, roads and brakes also contributes roughly the same amount of pollution. It is of importance because of the consistently strong evidence that it causes heart and lung disease, such as heart attacks or lung cancer. It can be particularly harmful to children and can cause early deaths, asthma, or developmental issues. The elderly are also more at risk, as well as people living with long term conditions.
Nitrogen dioxide is another harmful pollutant that can be caused by combustion in car engines, and it leads to increased amounts of heart or lung disease. In 2017 each of the constituent members of WMCA have a road above legal limits for this pollutant and both Birmingham and Coventry have been identified by DEFRA as local authorities that may still be above this limit by 2020, without further action.
Emissions
Map key
Average level of Particulate Matter
Industrial areas
Greenspace
Traffic conditions
Map Key
Average level of Nitrogen Dioxide
Industrial areas
Greenspace
Traffic conditions
Physical Activity
Map Key
Percentage of commuting trips made by bike
X.XX
"Physical activity has the greatest effect on health when people who would be otherwise inactive are enabled to become active. "
One of the most convenient ways for people to be physically active is to build it into their daily routine. This includes cycling and walking, and walking to and from public transport can also help people get enough physical activity during the week to have a protective effect. The Chief Medical Officer’s advice is to get 150 minutes of moderately intensive physical activity every week and people who cycle for transport are four times more likely to meet this.
In the West Midlands around 3 in every 10 people get less than 30 minutes of physical activity every week. 90,000 fewer people would be inactive if the physical activity rate could be increased to the England average. Physical inactivity is more common in the elderly, people in semi-routine or routine occupations and people with disabilities.
Physical inactivity has been linked with early deaths and the onset of many health conditions such as circulatory disease, type 2 diabetes, some cancers such as breast and colon, and depression. Even small increases of physical activity can have a big protective impact against ill health, especially amongst people who would otherwise be physically inactive. Because of the large impacts, increasing physical activity is an effective way to reduce short term sickness absences.
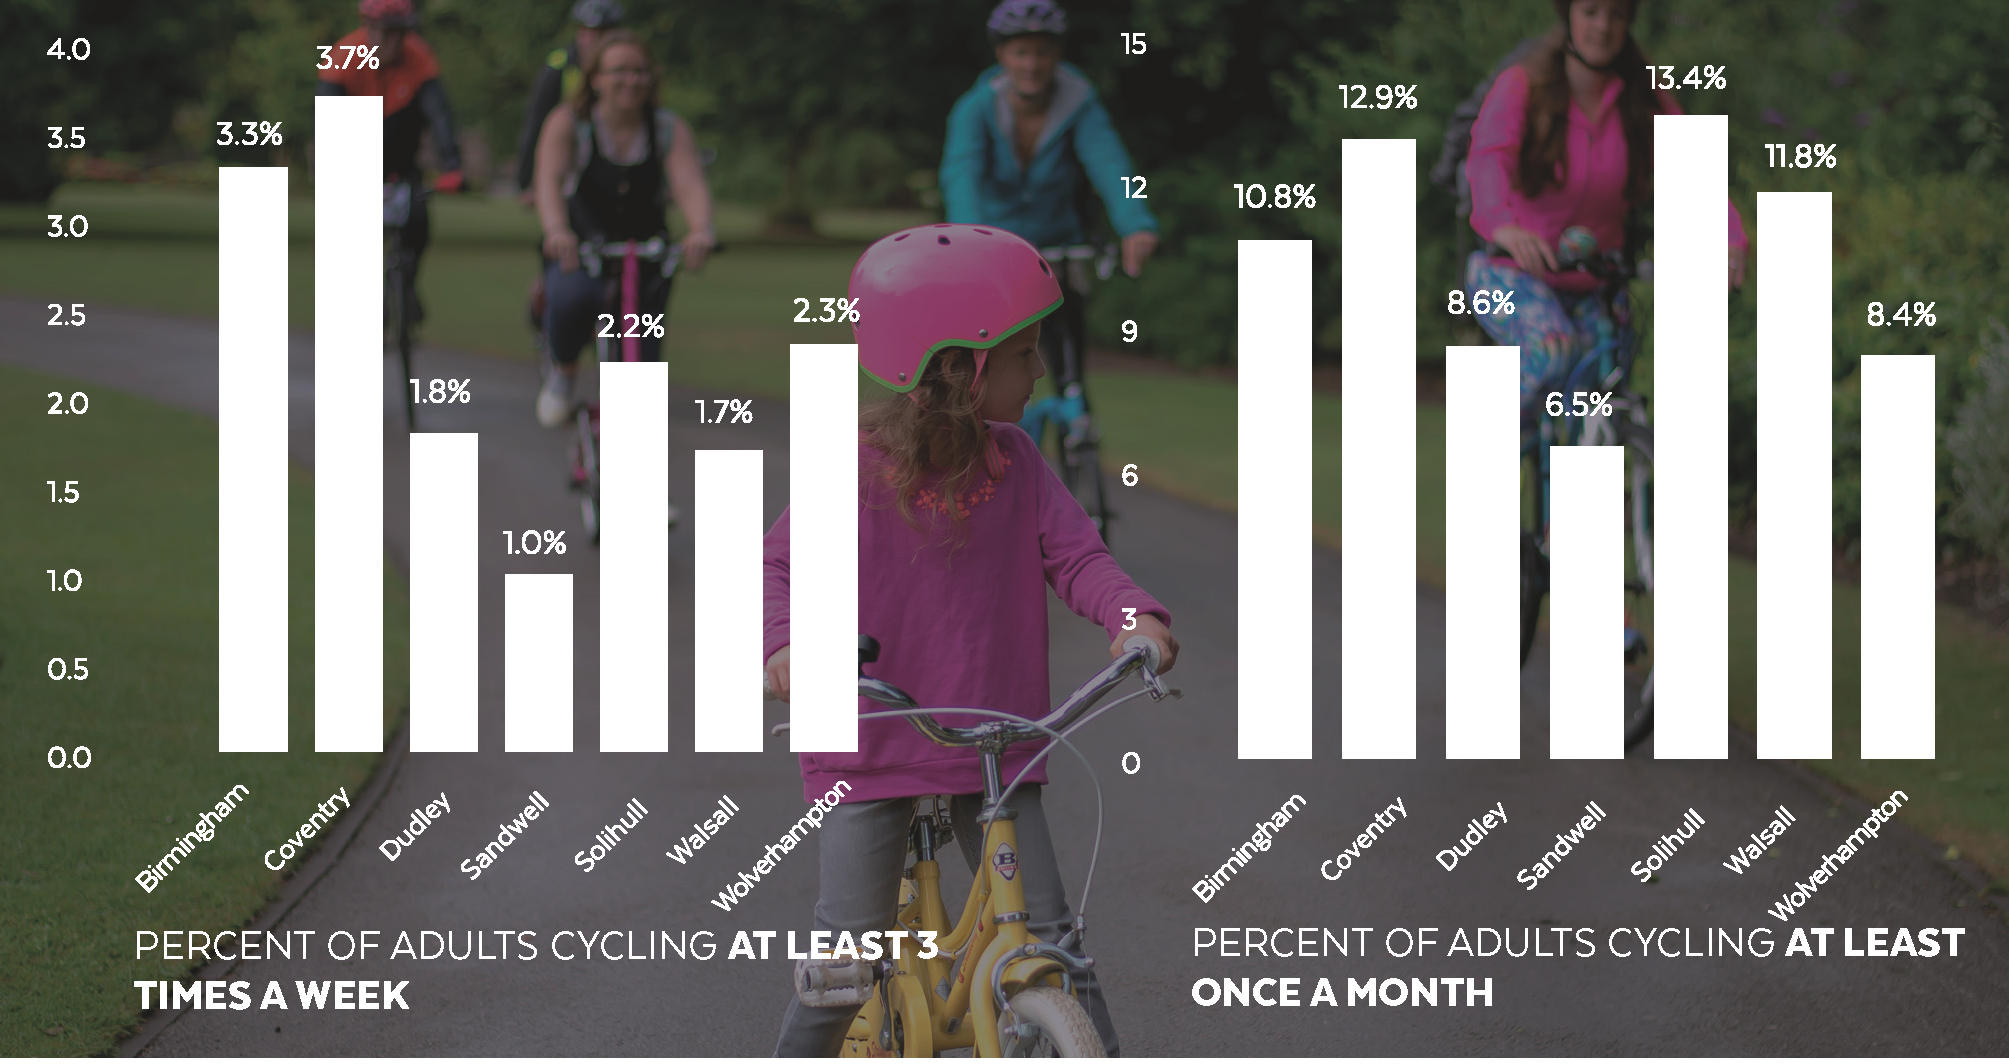
In 2011 around 1.8% of adults cycled to work and through the West Midlands Cycling Charter there is the ambition to increase this to 5% by 2023. There are many people who are more casual cyclists and around 10% of adults cycle at least once a month who might be encouraged to cycle more. There is a similar picture for walking. There is strong evidence that dedicated cycling infrastructure and improvements to make the streets feel safer can increase the amount of walking and cycling.
"In 2011 around 1.8% of adults cycled to work and through the Cycling Charter there is the ambition to increase this to 5% by 2023."
Travel to work
Travel to work by Foot
What does the data show?
This shows the percentage of people in an area who typically walk to work.
Where is the data from?
Commuting information was collected through the national census in 2011.
What is it measured in?
Percentage of the population
Map Key
Footpaths
Percentage of the population who are walking to work
Walking to work
Walking for transport in the West Midlands
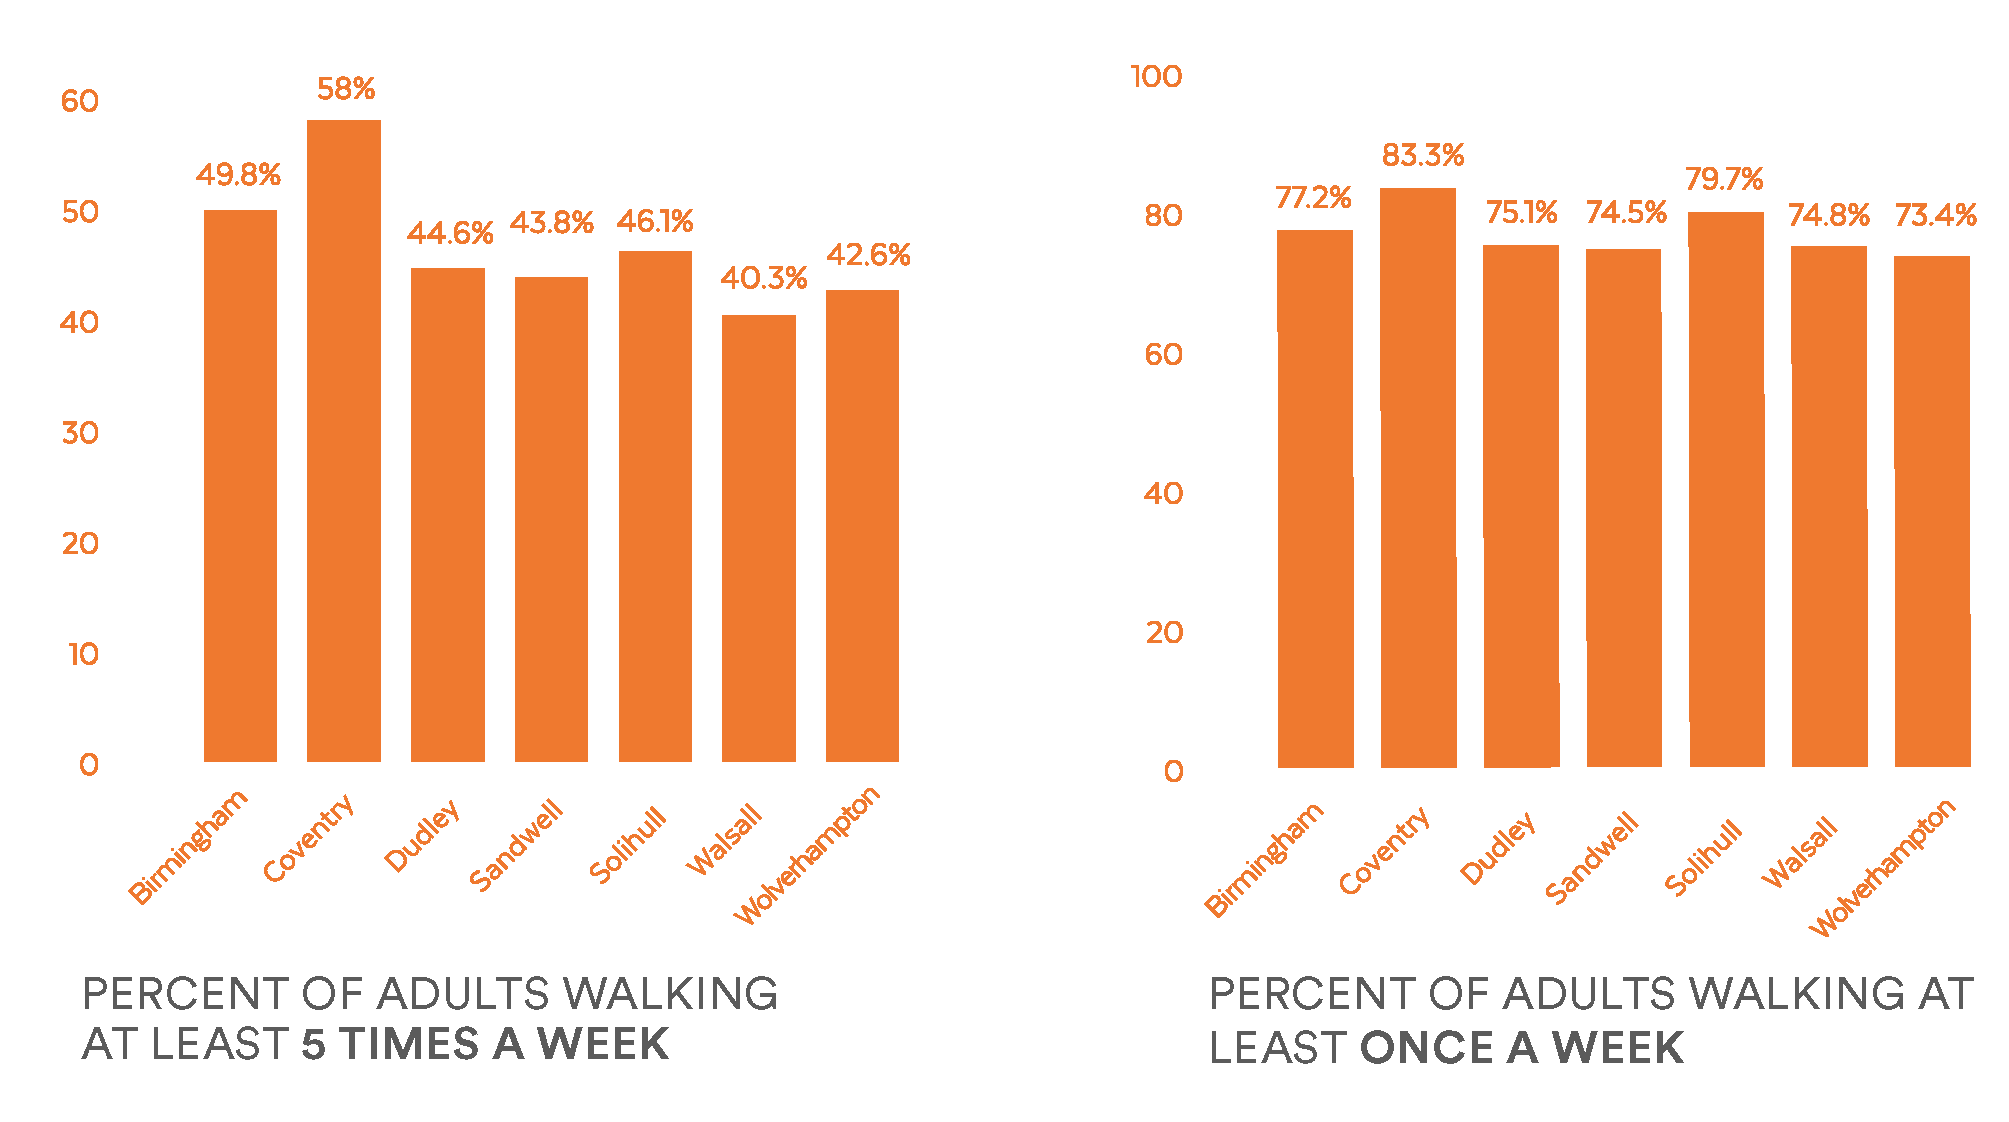
Walking is the most likely way that most adults will meet the CMO recommended physical activity levels.
Currently around 1 in every 10 journeys to work in the West Midlands are entirely by foot, however, this disguises many more walking trips. Many people walk to and from public transport such as buses and train stations. Although these are relatively short distances, they are important ways to improve health and wellbeing, especially amongst people who would otherwise be inactive.
More people walk during the week than is suggested using commuting statistics. Counting walks of only 10 minutes or more, over 40% of adults walk five times a week and most walk at least once. These might be trips to destinations other than work, or for leisure.
The Movement for Growth 10 year delivery plan sets out the importance of the built environment to encourage walking by improving the public realm and reducing vehicle speeds through area wide 20mph speed limits.
Travel to work by Bicycle
What does the data show?
This shows the percentage of people in an area who typically cycle to work.
Where is the data from?
Commuting information was collected through the national census in 2011.
What is it measured in?
Percentage of the population who are cycling to work.
Map Key
Cycle Routes
Percentage of the population
Travel to work by Bike
Cycling for transport in the West Midlands
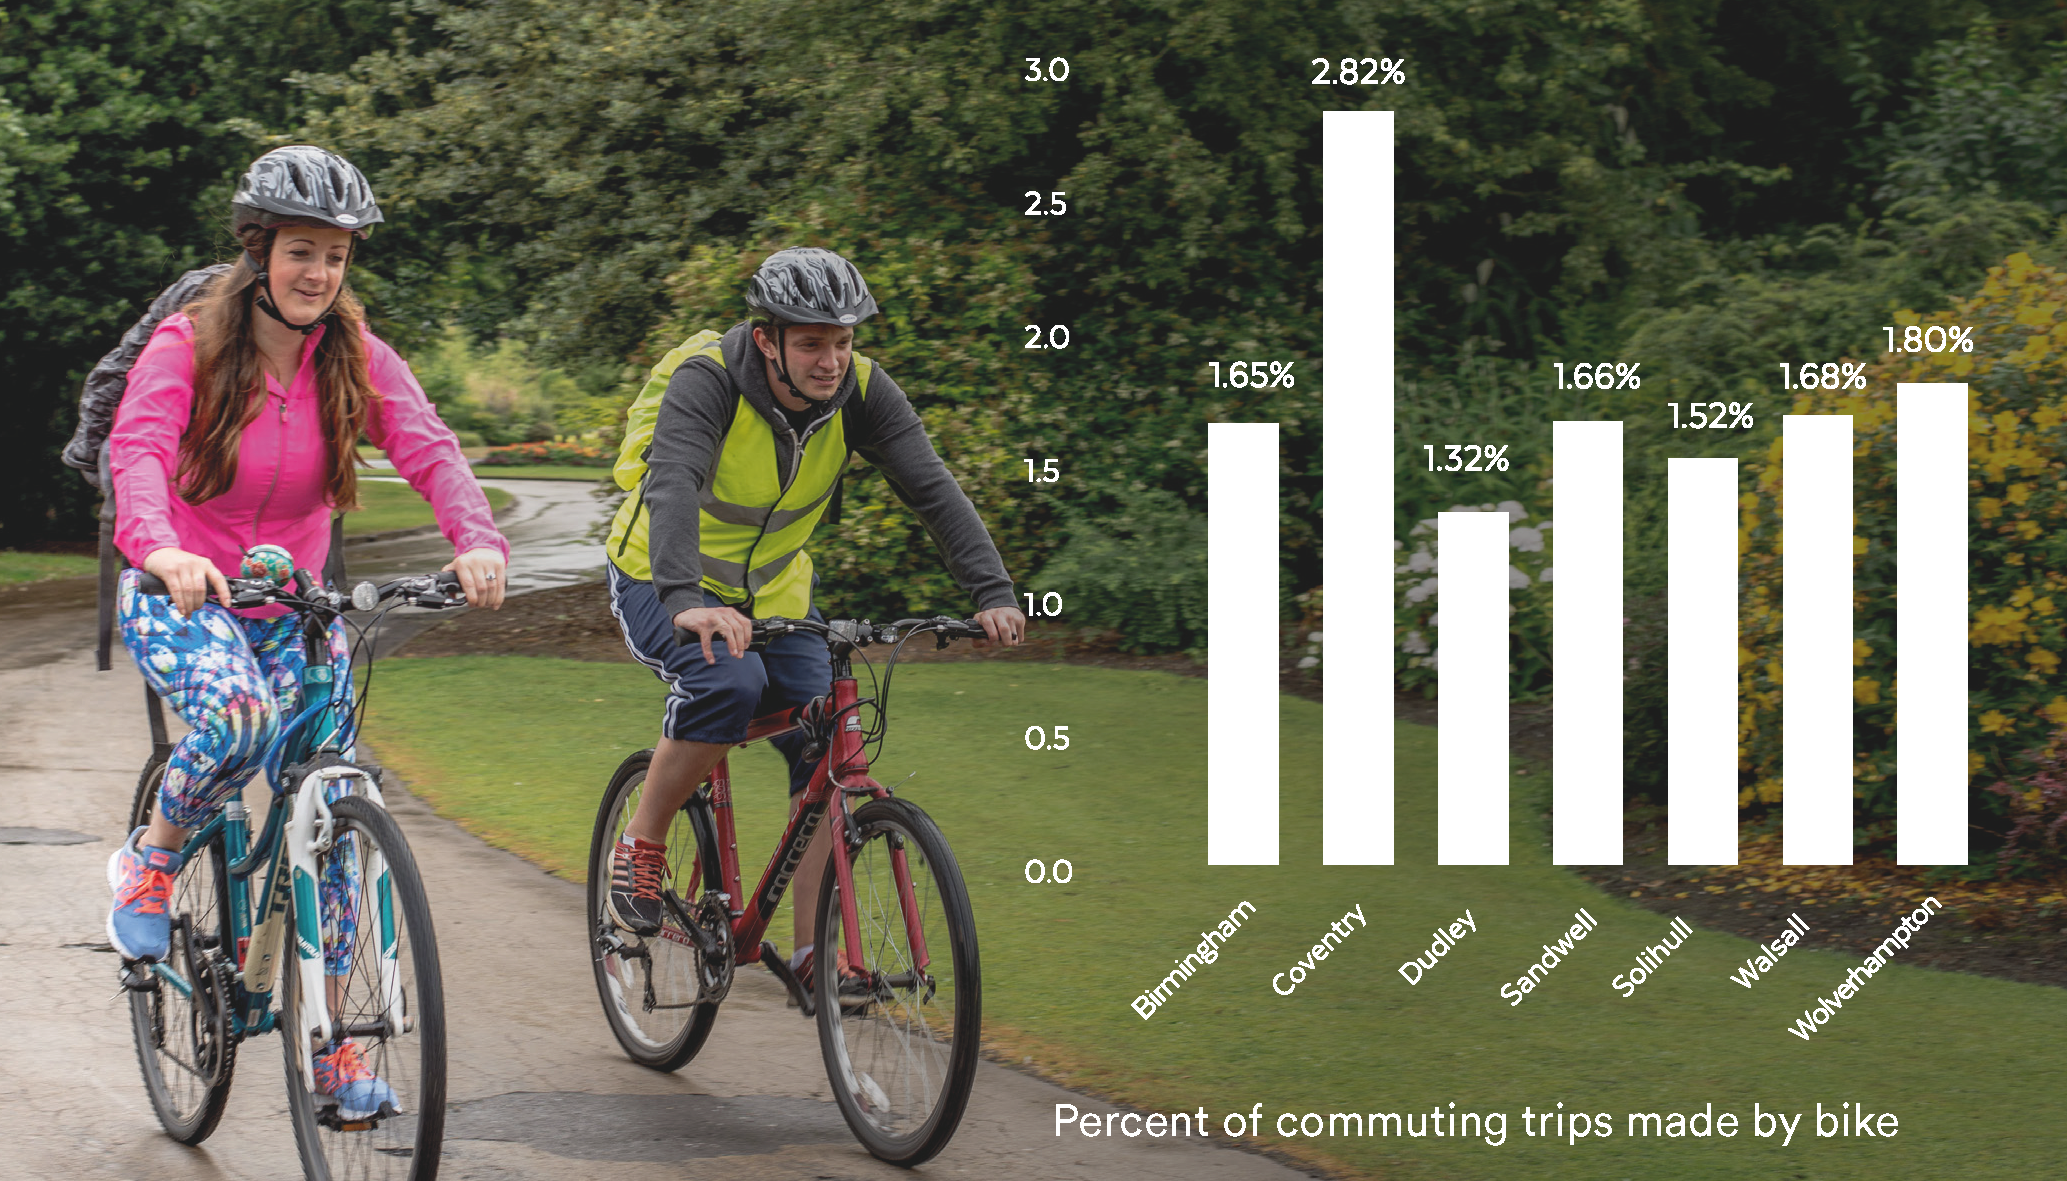
Currently, around 1.8% of commuting trips are made by bike. This varies between local authorities.
More adults have access to a bike and cycle than cycle for commuting purposes, and in some parts of the West Midlands over 10% of adults report cycling at least once a month.
This shows that there are more casual cyclists in the West Midlands than people who cycle to work, and that there is opportunity to increase the amount of cycling amongst casual or leisure users.
The built environment and perceived safety of the roads can often be a barrier to cycling. Dedicated cycling infrastructure such as cycle parking and dedicated cycle lanes increases the amount of people who cycle.
Women have a higher preference for predicated cycle lanes and their provision may reduce the inequalities in physical activity between genders.
The Combined Authority board has approved the development of a strategic cycle network across the area, which links between constituent and non-constituent members. This can be integrated with local networks. West Midlands Cycle Design Guidance has also been approved in order to create a better environment for cyclists.
Birmingham City Council is planning a segregated cycleway along the A38 (between city centre and Selly Oak) and A34 (between city centre and Perry Barr) as part of the Birmingham Cycle Revolution programme.
Travel to work by Rail
What does the data show?
This shows the percentage of people in an area who typically travel by train to work.
Where is the data from?
Commuting information was collected through the national census in 2011.
What is it measured in?
Percentage of the population who are using the train to get to work.
Map Key
Footpaths
Percentage of the population who are walking to work
Travel by Rail
Commuting
Commuting can have a negative impact on mental health. Shorter commute times increase job satisfaction and reduce turnover, as well as increase satisfaction with leisure time and improve mental health.
The shorter the commute, the greater the positive impact on mental health. The opposite is true with longer commutes and bus users particularly feel increased negative impacts on mental health from longer commutes.
People in Britain who commute longer distances are less satisfied about their health and more likely to visit their GP. This is mostly seen on forms of transport where there is more likely to be crowding, congestion or delays, and these can lead to the feeling of not being in control and lead to poorer mental health.
Longer commutes reduce time for other health promoting activities, such as spending time with family or friends, sleep, or exercise.
There is developing evidence that commuting by bike can have a positive impact on productivity. Cyclists were more likely to agree that they arrived at work ‘energised’ than commuters using different modes.
The relationship between commuting mode and productivity is an important area for further research. The potential health impacts of working from home is also an area where more research is needed.
Shorter commute times incriease:
- Welbeing and mental health
- Job satifaction
- Time spent with family or friends
- Amount of sleep
- Oppurtunity to exercise
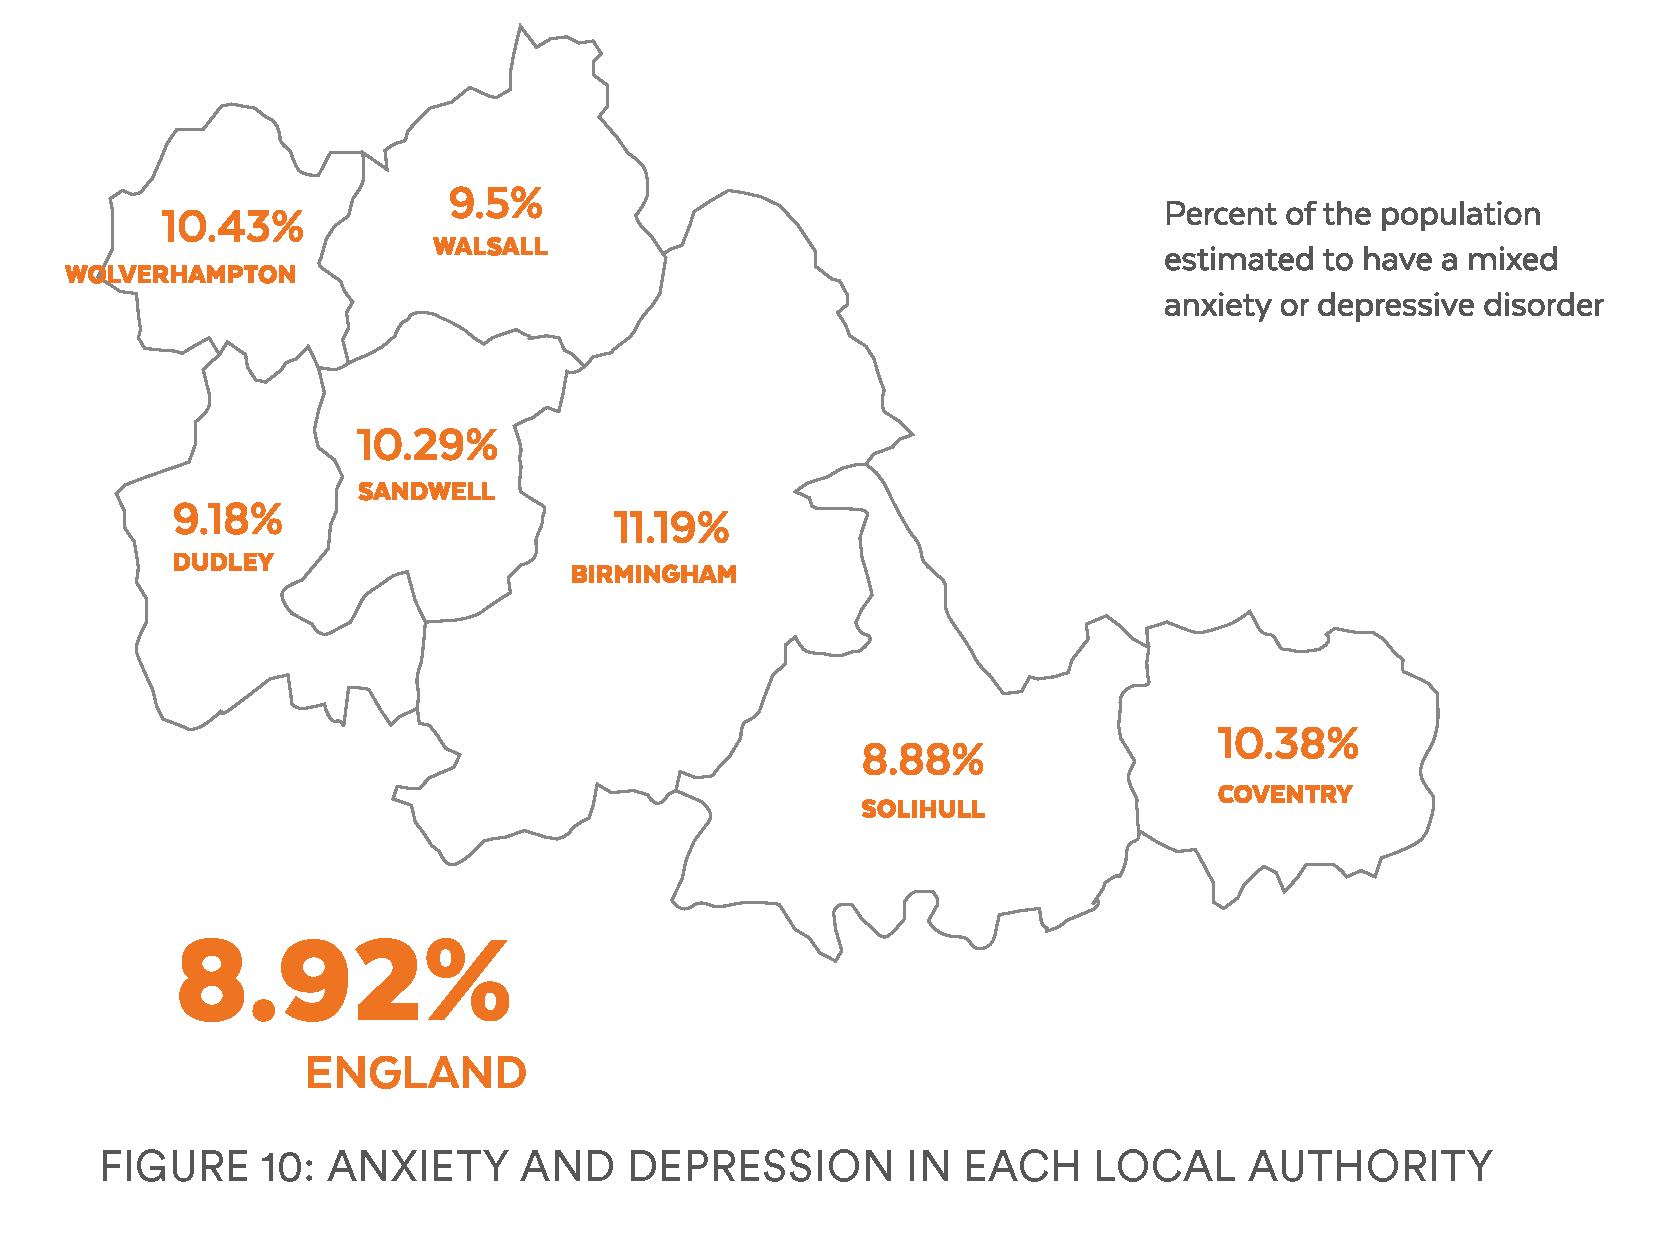
Mental wellbeing and social cohesion
Map Key
Percentage of the people requiring support for depression
‘Thrive West Midlands: an Action Plan for change’, sets out the ambition to improve mental wellbeing in the West Midlands and reduce the impact that poor mental health can have on people’s lives. It is estimated that over 200,000 adults in the West Midlands aged between 16-74 have either a mixed anxiety or depressive disorder at any one time. There would be 30,000 fewer if the CA average was the same as the average across the whole of England.
There are mental health benefits from reducing transport related noise and injury, and improving physical activity and perceived safety. The design of the transport system and street environment can also directly influence wellbeing.
Mental wellbeing and social cohesion
There is a direct relationship between mental health and the built environment as a whole. People who rate the built environment in their neighbourhoods as poor can be around 30% to 60% more likely to report having depression in the last six months, with higher rates of lifetime depression.
Compared with physical health, there has been less discussion and research on street design and its relationship to mental health and wellbeing. This is an important area for research to understand how streets can meet the objectives of Thrive West Midlands.
There have been few studies on the relationship between how the design of streets encourages people to walk and mental health. Whilst the overall relationship between mental health and street design is unclear, some characteristics such as increased volumes of traffic have been shown to increase psychological distress.
Transport and social cohesion
Street design can increase social contact between residents. Social contact and supportive social networks strengthen mental resilience in children66 and improve community cohesion. People who are socially isolated are at greater risk of poor mental health,67 68 and isolation can have much wider impacts on early deaths, hospital admissions in the elderly and cardiovascular disease.69 Whilst isolation can occur at any age, the elderly are more at risk of being socially isolated.
If street design helps people to walk to places then it will directly impact on the strength of the local community. People who can walk to local services know more neighbours, are generally more trusting of people, and have more social contact.70 The ease of accessibility of local services such as shops, parks or other facilities also increases the number and strength of social connections that people have.
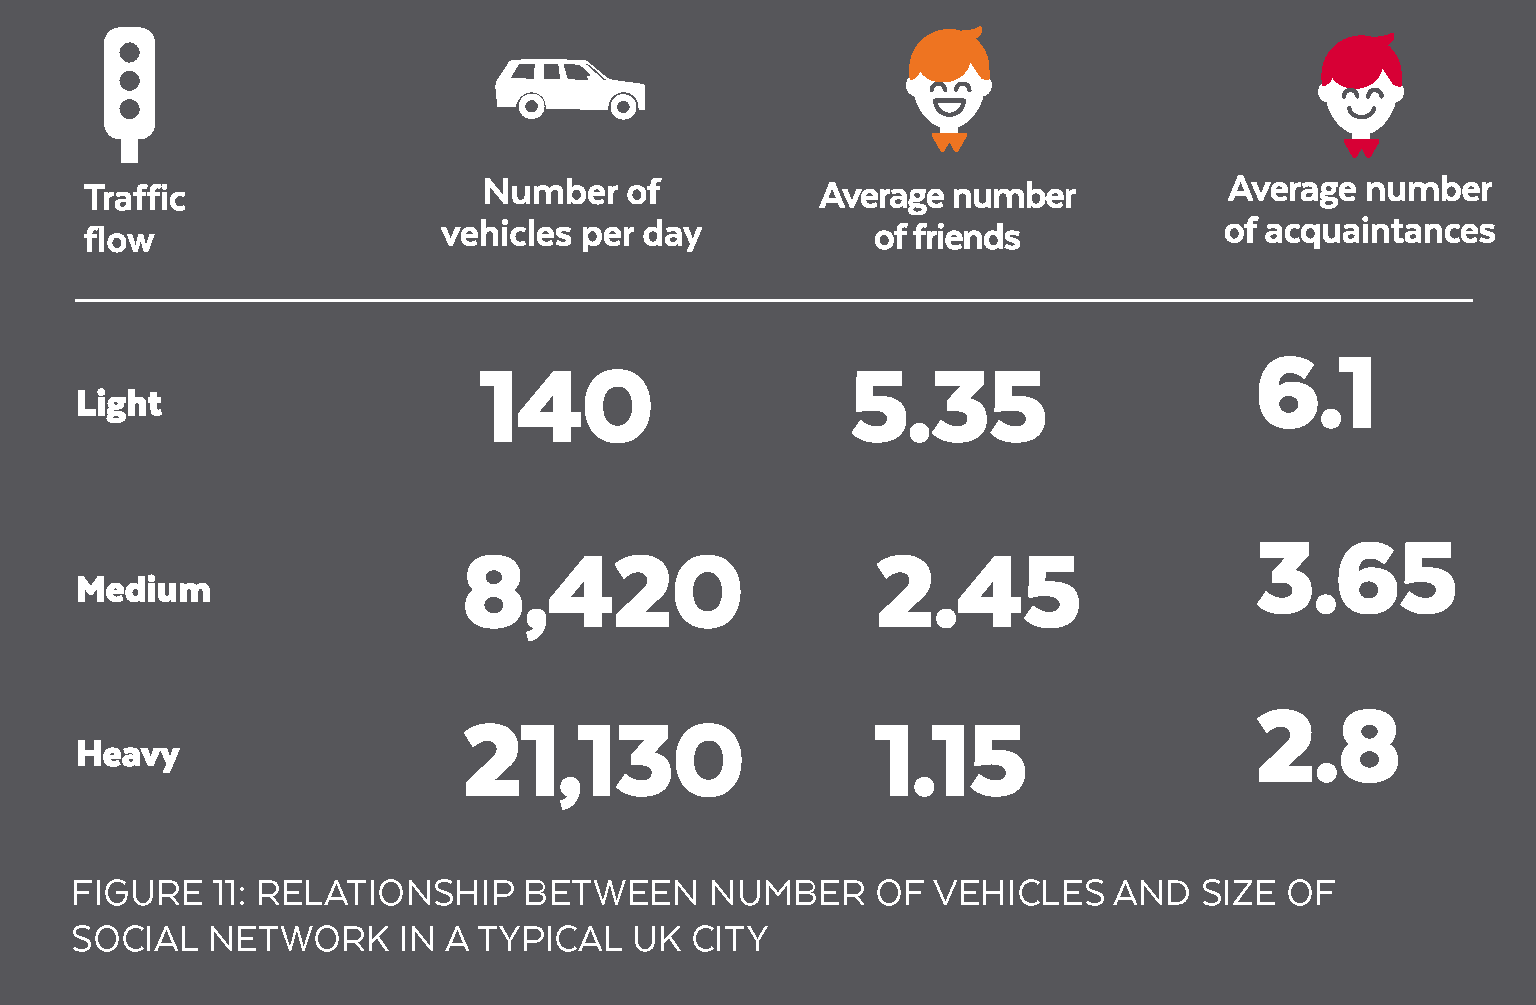
Streets with less traffic encourage larger social networks and places where people are more likely to stop and chat. People on streets with smaller traffic volumes are more likely to have more friends and acquaintances.
Safer Streets
Map Key
20 Mph speed limits
Most of the West Midlands has lower injury rates than England, however, this is not necessarily true of all groups and children are more at risk of serious or fatal injury. Children living in more deprived areas are 4 times more at risk of being seriously injured or killed than children living in the more affluent areas. In part this is because of more unsafe roads and larger amounts of walking.nSeveral countries have taken the ethical position that streets should be designed so that a human error that causes a driver to hit a pedestrian is unlikely to lead to a death. This is known as a ‘safe systems’ approach and countries that have adopted this provide dedicated infrastructure for cyclists and pedestrians on high speed roads and reduce vehicle speeds in areas where this cannot be provided. Vehicle speeds of around 20mph are unlikely to kill pedestrians in a collision and many local authorities in the West Midlands are introducing 20mph speed limits across wide areas.
If hit at 20mph, out of every 200 pedrestrians will be killed. At speeds of 30mph, the risk of death is around 1 in ten.
85% of serious and fatal child pedrestrian injuries occur on roads with 30mph limits.
Safer Streets
Safer streets are essential in helping people move around the West Midlands without perceived or genuine risk of injury. Reducing the danger that people are exposed to decreases the risk of injury, but also encourages people to walk or cycle.
Human error is often cited as the major cause of traffic collisions. One perspective is that errors are a result of a set of circumstances and they can be prevented rather than being random events.79 Roads can also be designed so that errors do not result in deaths.
Addressing these underlying causes and ensuring that common errors do not lead to deaths can also reduce road danger and improve perceptions of safety. In this way, action to improve road safety can have a much wider influence on health beyond preventing injuries.
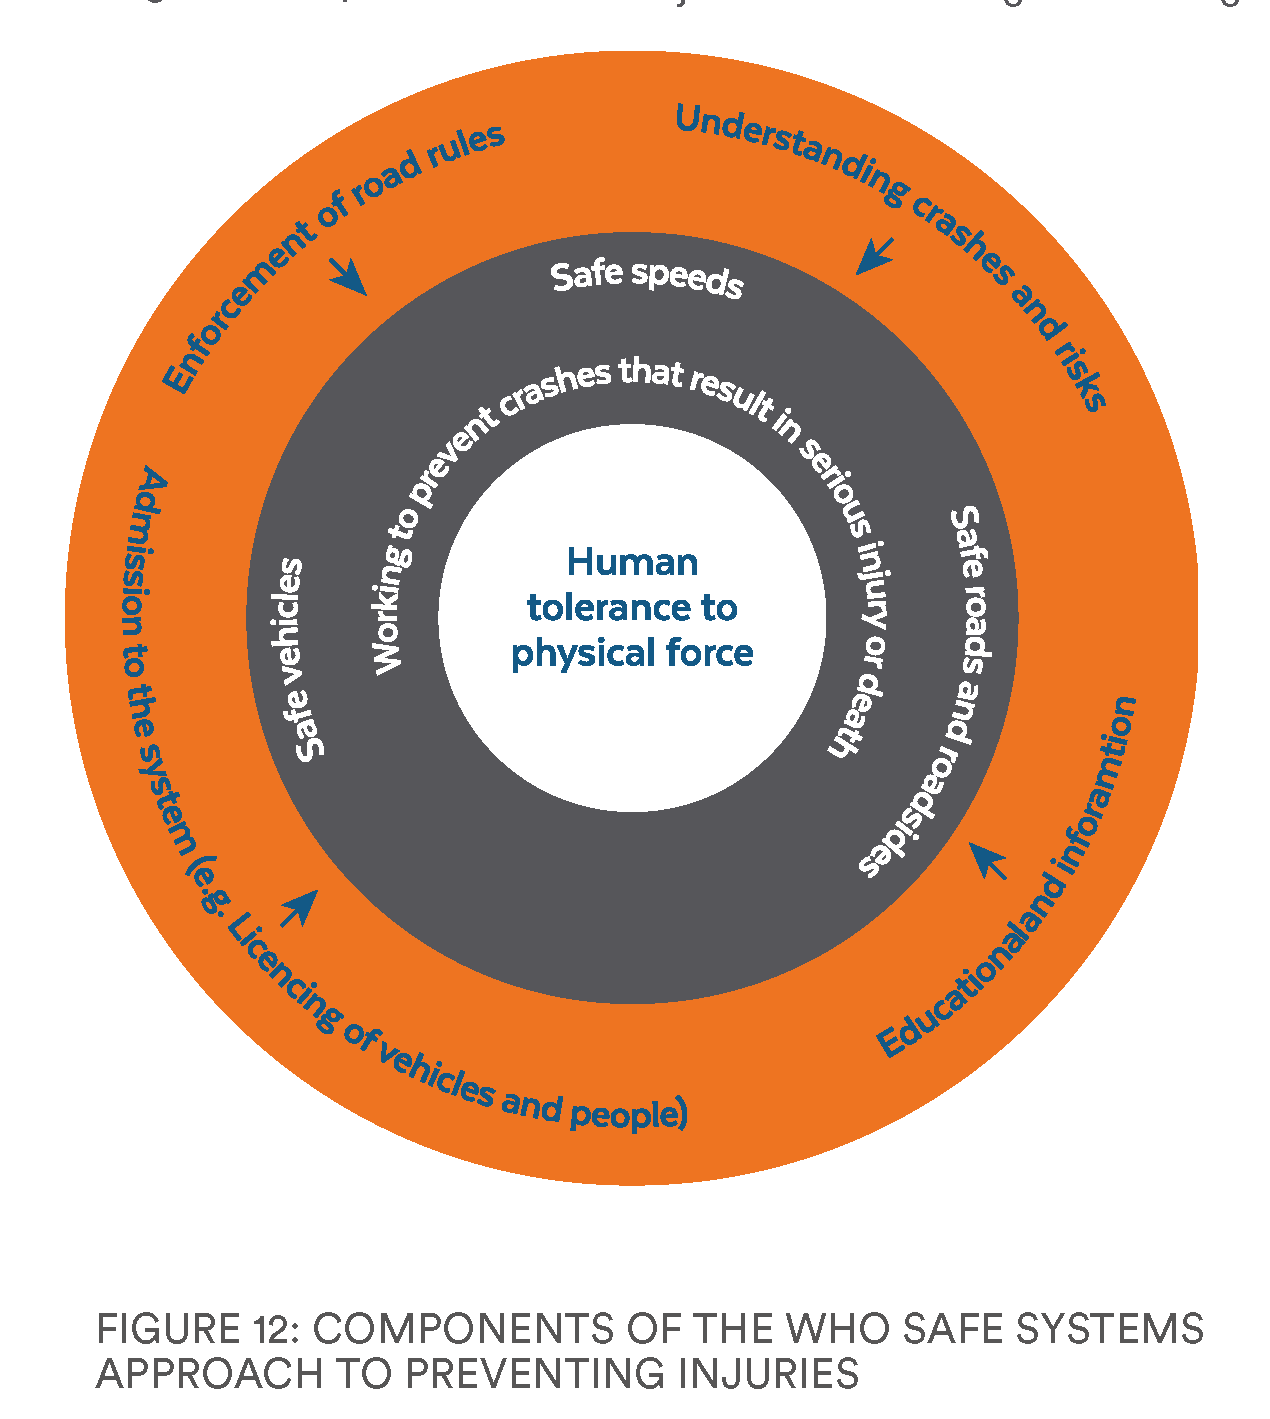
The World Health Organisation has promoted a ‘safe systems’ approach to road safety based on the Vision Zero approach in Sweden and Sustainable Safety in the Netherlands. Under these approaches, it is considered unethical to design roads where an error could lead to deaths.
Based on the understanding of how likely people were to die in a typical collision on different road types, speed limits were set to reduce the chances of this happening and segregated facilities provided for cyclists and walkers on roads that required higher speed limits. Over half of all deaths could be prevented by adopting a safe systems approach.
Part of a safe systems approach is 20mph limits in areas where pedestrians are at risk. If hit at 20mph, 3 out of every 200 pedestrians will be killed. At speeds of 30mph, the risk of death is around 1 in every 10. A recent analysis has shown that across England, around 85% of serious and fatal child pedestrian injuries occur on roads with 30mph limits, showing the wide potential of reducing vehicle speeds.
This approach that reduces the speed of traffic also improves people’s perceptions of safety. This supports other ways of keeping healthy, such as increasing people’s confidence to cycle and walk.
The Movement for Growth 10 year delivery plan identifies areas where 20mph areas will be introduced to encourage active travel and improve safety. This includes Coventry’s ambition to be a 20mph city.
Children who live in deprived areas are more likely to be killed on the roads as pedestrians and cyclists. This is because of the more unsafe road environment, and the larger amount of walking that children do.85 Within the WMCA area there are typically higher rates of child serious and fatal injuries than the England average.
Across England, children aged 5-9 who live in the most deprived 20% of households are nine times more likely to be killed or seriously injured as a pedestrian than children who live in the 20% most affluent areas. Among 10-14 year olds the rate was just under four times as high. A similar picture is seen for child cyclists.
Traffic injuries have longer term impacts including psychological distress or other mental health issues for up to three years following the crash.87, 88 More severe physical injuries seem to lead to higher levels of psychological distress.
Location of KSI (Killed or seriously injured) collision
What does the data show?
This shows the location of where police reported serious or fatal collisions.
Where is the data from?
Various police data sources
What is it measured in?
The number of incidents reported in each area.
Map Key
Number of incidents reported
Number of reports of Killed or seriously injured
XXX
What does the data show?
This shows the location of where police reported serious or fatal collisions.
Where is the data from?
Various police data sources
What is it measured in?
The number of incidents reported in each area.
Map Key
Number of incidents reported
What does the data show?
This shows the location of where police reported serious or fatal collisions.
Where is the data from?
Various police data sources
What is it measured in?
The number of vehicles involved in each collision.
Map Key
Serious
Fatal
Noise
What does the data show?
This shows the average levels of noise pollution at night time over a year. Noise pollution may be higher or lower at different times during the night.
Where is the data from?
Night time noise levels were modelled by Defra in 2012.
What is it measured in?
Decibel meter reading with 0 dBA being the softest level that a person can hear. The higher the figure, the louder the noise.
Map Key
Decibel meter reading
Noise
Transport is a source of noise. This noise comes from a variety of sources such as vehicle engines, the interaction between tyres and the ground, and wind resistance.
Sound can affect people in different ways, depending on the situation and the environment as well as sensitivity to the noise and attitudes about it. If people do not feel in control over a sound or that it is unfair that they should hear it, they are more likely to notice it and react negatively.
Quiet or calming sounds, particularly from natural sources, can have a positive effect on people. Quieter places indicate safety and put people at ease.
Alternatively, louder pleasant sounds from a bustling public space can create a lively and exciting place that people enjoy.
Positive effects can be lost, particularly when sound is unwanted or when it masks quieter reassuring sounds. Loud noises produced at a distance can then have a negative impact.
Although excessive exposure to loud noise can damage hearing, there are also health implications at lower volumes. Even at low volumes, transport noise can be perceived as negative and act as a cause of stress or disturbed sleep. This is how it has a direct impact on health as well as quality of life.
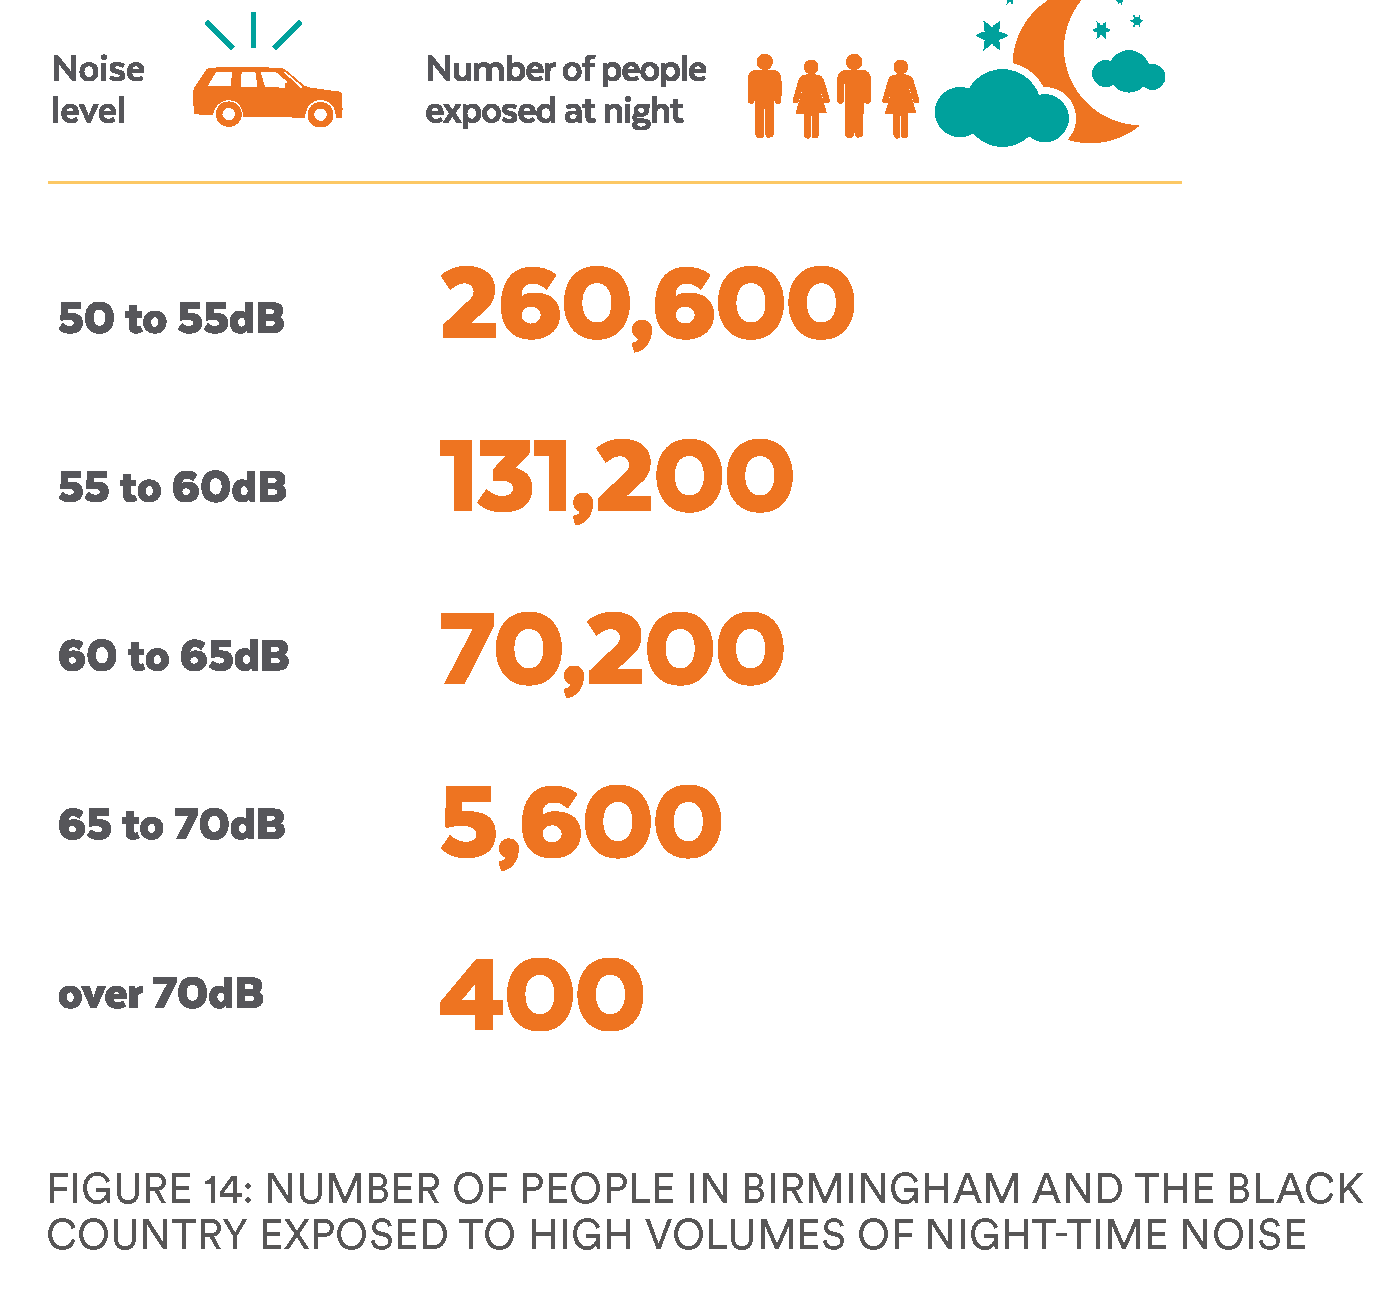
Night time noise is usually measured as an annual average and between 11pm and 7am. During this period, exposure to average noise levels of around 55db and above are considered by WHO as increasingly dangerous to public health.91 This is slightly quieter than many fridges. Over 200,000 people in the Birmingham and Black Country urban conurbation are exposed to average road traffic noise above this level at night.
Sleep disturbance and waking can occur at much lower volumes. People in groups who typically sleep longer or have fragmented sleep patterns are considered more at risk of the effects of night time noise. Groups with these sleeping patterns include children, the elderly, pregnant women, people with ill health, and shift workers.
The highest burden from noise on health and wellbeing is predominantly through sleep disturbance and annoyance. Noise annoyance can effect wellbeing by causing negative responses, such as anger, disappointment, dissatisfaction, withdrawal, helplessness, depression, anxiety, distraction, agitation or exhaustion. Noise also increases the risk of heart disease due to increased stress, which can have physical symptoms such as tiredness and stomach-discomfort, and raised blood pressure.
The evidence is developing about a range of other plausible health impacts such as increased risk of diabetes and low-birth weight births. There is a potential relationship with diagnosed mental health and people with depression are being more likely to report noise as a problem in urban areas.
Children are less able to deal with the stress caused by noise as they have not developed the same coping mechanisms as adults. In children there is evidence that noise is linked to emotional symptoms, conduct problems and hyperactivity.
Some studies have shown that road and rail noise also has a negative impact on mental health in primary school children, and predominantly in children who were born preterm, with a low birth weight.
Noise also has an impact of school performance and learning outcomes. Higher levels of noise exposure worsens memory, performance in tests and can cause a delay in reading age. WHO recommend that background noise should not exceed 35dB during teaching sessions.
Across the West Midlands there are variations in the number of people exposed to road, rail and air traffic noise.
Health and Wellbeing within the West Midlands
Map Key
Average Male & Female Healthy life expectancy
X.XX
Life expectancy describes how old an average person in an area can expect to live and can be used to describe the health of an area, as lower life expectancies suggest that ill health causes people to die earlier. In England, the life expectancy for men at birth is 79.5 years old. On average, women tend to live longer and female life expectancy at birth is 83.1 years old in England.
Six of the seven local authorities in the West Midlands have lower life expectancies at birth than England. The lowest male life expectancies are 77.1 years in Birmingham and Sandwell, compared with the highest of 80.4 years in Solihull. There is variation in female life expectancies, and in it is 81.3 years old in Wolverhampton compared against 84.2 years in Solihull. The differences of several years show that some areas of the West Midlands are in poorer health.
Life expectancies for both men and women have increased across all the West Midlands since 2001- 2003. There is some evidence that since at least 2011-13 life expectancies have not increased as quickly.
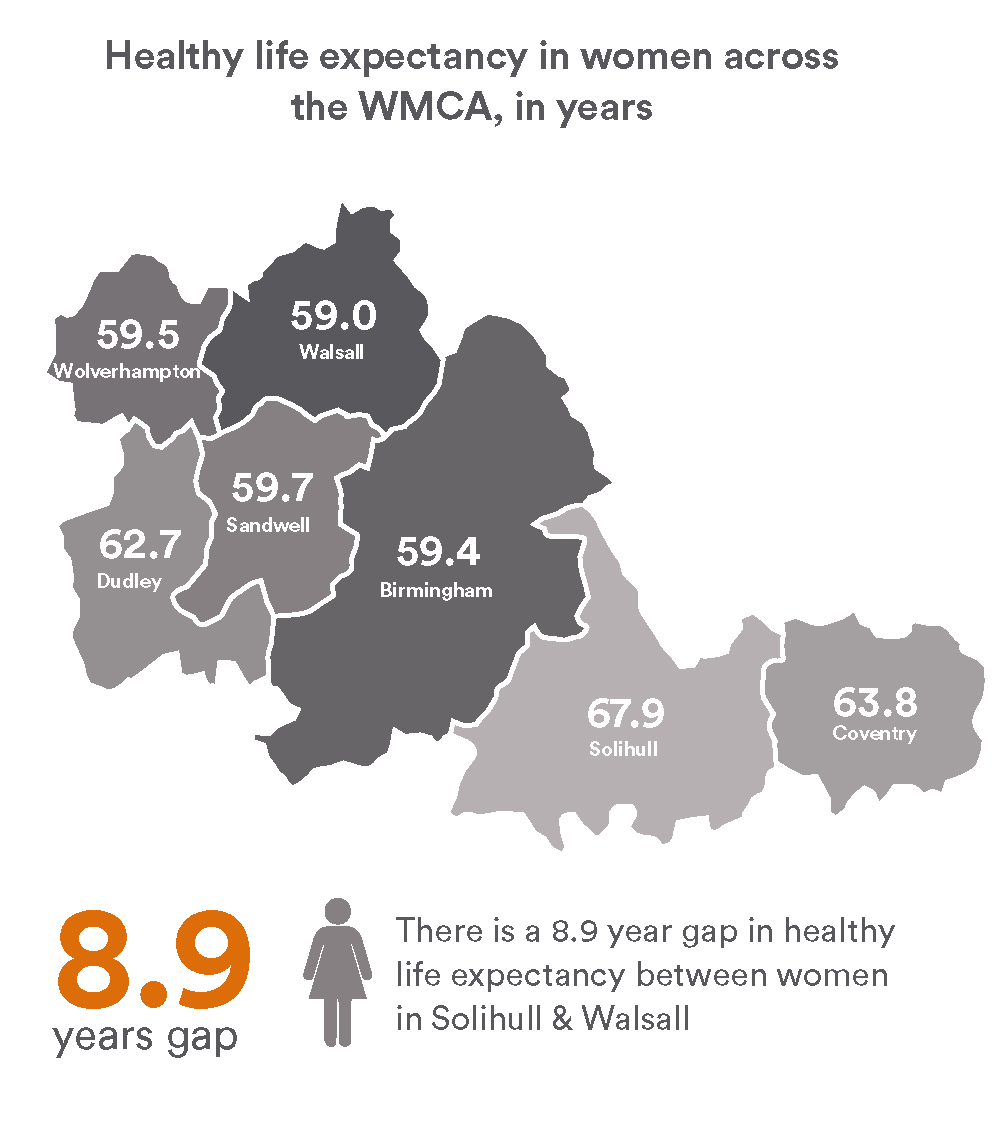
There are differences in healthy life expectancy at birth within the West Midlands. In Wolverhampton, the healthy life expectancy for men is 56.4 years, compared against 63.8 years in Solihull. Women generally have higher healthy life expectancies and amongst women the lowest healthy life expectancy is 59 years in Walsall and the highest is 67.9 years in Solihull.
Local authorities with lower life expectancy typically also have higher rates of unemployment and more people with long term sickness and disability. In areas of low healthy life expectancy over half of men aged 25 to 64 who are out of work and not seeking work have long term illnesses.
There is a connection between healthy life expectancy and skills. Fewer people in areas of low healthy life expectancy have a qualification of NQF Level 4 and above. However, people with similar educational levels were more likely to report better health in areas of higher healthy life expectancy.
Healthy Life Expectancy
Male Life Expectancy
What does the data show?
This shows how old an average man might expect to live in good health, in a given area.
Where is the data from?
Healthy life expectancies were calculated based on 2009 to 2013 data, and were published by ONS in 2015.
What is it measured in?
Average age ranges a man might expect to live in good health in a given area.
Map Key
Healthy life expectancy age
Female Life Expectancy
What does the data show?
This shows how old an average women might expect to live in good health, in a given area.
Where is the data from?
Healthy life expectancies were calculated based on 2009 to 2013 data, and were published by ONS in 2015.
What is it measured in?
Average age ranges a woman might expect to live in good health in a given area.
Map Key
Healthy life expectancy age
The impact that transport has on health and wellbeing
Map Key
Bus Routes
Rail Routes
Tram Routes
Transport schemes or programmes can have the greatest impact when they are designed to have a positive influence on many of these. Understanding these links helps to prioritise interventions that will have the greatest impact and maximise the benefits of investments to improve health through transport.
Not everyone benefits equally from the same intervention. There are groups of people or areas within the West Midlands where there is a greater potential to improve health and wellbeing. The benefits of transport schemes can also be maximised when they are designed to reduce health inequalities and are targeted at these areas or groups.
The impact that transport has on health and wellbeing
Benefits can also be maximised when street modifications or improvements are carried out to consider the wider health and wellbeing needs of residents or people who use the street. By doing this, the same intervention can often help to improve health and wellbeing in a wide range of ways, even when primarily targeted at one issue. Unintended negative impacts can also be identified and prevented by taking this approach.
Our approach to improving health through transport
There are actions that we can take to maximise the positive impacts that transport has on health and wellbeing. This can be done by embedding health and wellbeing considerations in to our approach to transport. By doing this opportunities and implications of schemes can be identified and acted upon. A set of actions has been developed to embed health into our approach.
To consider the breadth of health and wellbeing issues, a range of public health data and evidence is available. There is expertise in interpreting this data in the public health teams in constituent members. Often this evidence can be used to develop the business cases of schemes that improve health and wellbeing.
There are connections between different health and transport issues that might be missed if there is only a focus on single issues. Attention needs to focus on groups who might have the greatest health and wellbeing benefit and to protect groups most at risk. This report has identified children, the elderly and people living in deprived areas as these groups.
The design of streets and public places is an example of a transport intervention that can impact on multiple health issues. This report has identified many urban design interventions that can improve health and wellbeing by encouraging more walking.
ACTION ONE: We will use data on population health to help prioritise and target interventions
There is data and information that describes the health of local authorities and smaller geographies within them that can be used to assess health needs and how much benefit can be gained. That data will be included in the strategic outline cases for transport schemes that will improve health and wellbeing.
Across local authorities, the Public Health Outcomes Framework contains a set of indicators that explain the relative health and wellbeing of an area. This draws on a wide range of sources of data and is regularly updated when new data becomes available. To make best use of it, we will identify indicators that relate to transport and health and publish and update profiles for each local authority.
To make best use of health data for smaller areas within local authorities, we will develop health and transport dashboards that will show the health of people around transport schemes and corridors. Local authorities can communicate their health priorities to TfWM through their Joint Strategic Needs Assessment. These should reference health and transport. We will work with the public health departments of our WMCA members to make sure that they have access to relevant data sets to help identify priorities.
ACTION TWO: Through our Equality Impact Assessment process we will assess the equity of health impacts.
No-one should be disadvantaged from achieving their potential to be healthy and everyone should have a fair opportunity to be in good health. Some areas and groups within the West Midlands have poorer health. By identifying and understanding the needs of disadvantaged groups at an early stage we can make sure that schemes help everyone to achieve good health and wellbeing.
We will consider how transport schemes impact on health inequalities through the existing WMCA Equality Impact Assessment process.
ACTION THREE: We will understand the social impact of transport schemes.
There are many benefits from investing in health. These might be directly to the health service or local authorities because of reduced need for health and social care or the value that people put on preventing early deaths or lost productivity and informal care costs. By calculating this value we will include health in the business cases and the benefit-cost ratio that is used to understand the value of the scheme.
We will use The World Health Organisation ‘Health Economic Assessment Tool’ to calculate the benefits of increased physical activity from cycling, walking and public transport schemes. This is in line with Department for Transport guidance.
The Department for Transport also approve the use of the Sickness Absence Reduction Tool. This gives a financial value on reduced sickness absence from increased physical activity.
There are other opportunities to describe NHS and local authority savings, but which are not approved for use in business cases by the Department for Transport’s appraisal. We will explore the use of these tools internally to understand the size of benefits that might be currently missed.
Some significant transport schemes will benefit from a health impact assessment to identify opportunities to mitigate any health impact of the scheme on health, or capitalise on the opportunities to improve health. These can help to complete TfWM objectives to prevent the exacerbation of air quality problems. We will identify opportunities to conduct health impact assessments of transport interventions.
In some constituent member local authorities these are being built into the planning process and highlighted in the local plan, and these should also refer to the opportunity to conduct health impact assessments on transport schemes. We will work with local authorities to conduct health impact assessments, as part of broader sustainability and environmental impact assessments, whether lead by the local authority or TfWM.
The health and wellbeing issues identified in this report will be used to structure and assess any health impacts and should be considered by transport consultancies who have been commissioned to carry out Health Impact Assessments, alongside issues such as access to health care.
ACTION FOUR: We will set out an evidence based statement of what makes a healthy and active street and trial the approach
Streets can be an asset to improve the health of people who live and work close to them. This is a role beyond protecting people from the risk of injury or poor air quality. Streets that increase social contact or walking, cycling are health promoting environments. This helps to address transport challenges of people walking or cycling short distances.
There is now a large and continually growing evidence base that sets out how people use places such as streets and how to encourage more walking and cycling for travel. This has a wider impact on wellbeing as greater amounts of walking for transport improve the sense of community or community cohesion..
The WMCA has approved cycle design guidance for the West Midlands to achieve high standards for key cycling routes. The Guidance can be used to develop spaces that encourage physical activity and social contact and reduce conflict between pedestrians and cyclists.
We will set out the evidence base for a healthy and active street environment that create better conditions for walking and improve community cohesion. This will provide a benchmark that streets can be evaluated against and set principles to enhance the public realm and local conditions for active travel.
We will work with constituent members to trial and evaluate a series of healthy and active streets projects over the next 2 years.